 K-means clustering of two-dimensional data
Beijing Institute of Technology | Ming-Jian Li
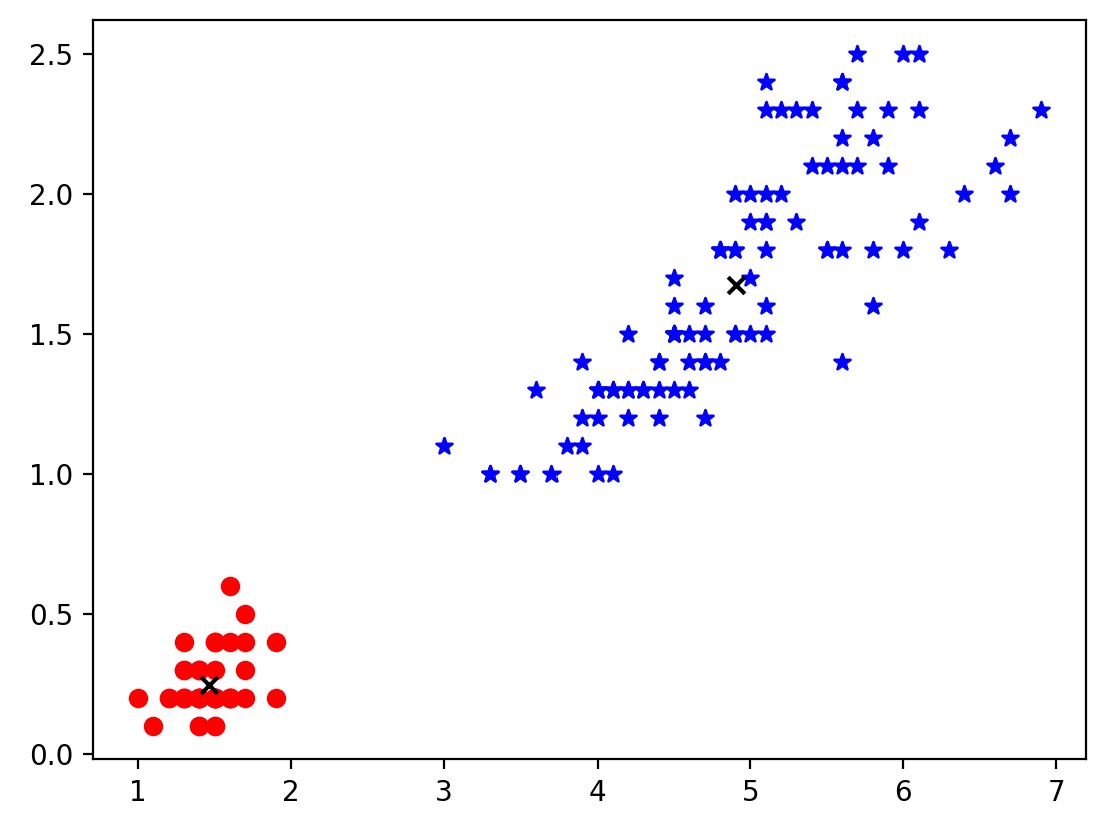
The following Python code is a companion code for the course on Artificial Intelligence and Simulation Science. It functions to cluster the data in dataset cluster.csv (click to download) using the k-means clustering method.
x1import pandas as pd2import matplotlib.pyplot as plt3import numpy as np4
5data=pd.read_csv(r'cluster.csv',sep=',')6
7x_value=data['radius'].values8y_value=data['weight'].values9
10M = len(data)11print(M)12
13plt.scatter(x_value,y_value,c='red')14plt.show()15
16# randomly generate 2 centroids 17def createpoint2():18 x=5*np.random.random(2)19 y=5*np.random.random(2)20 return x,y21
22point2=createpoint2()23p0=(point2[0][0],point2[1][0])24p1=(point2[0][1],point2[1][1])25
26def distance(p1,p2):27 return np.sqrt((p1[0]-p2[0])**2+(p1[1]-p2[1])**2)28
29# plot centroids 30plt.scatter(x_value,y_value,c='red')31plt.scatter(point2[0],point2[1],c='black',marker='x')32plt.show()33
34# calculate distance35for i in range(M):36 point=(x_value[i],y_value[i])37 if distance(p0,point)<distance(p1,point): 38 plt.scatter(point[0],point[1],c='blue',marker='*')39 else:40 plt.scatter(point[0],point[1],c='red')41plt.scatter(point2[0],point2[1],c='black',marker='x')42plt.show()43
44iter = 545
46for i in range(iter):47 # re-calculate centroids 48 new0_list=[]49 new1_list=[]50 for i in range(M):51 point=(x_value[i],y_value[i])52 if distance(p0,point)<distance(p1,point): 53 plt.scatter(point[0],point[1],c='blue',marker='*')54 new0_list.append(point)55 else:56 plt.scatter(point[0],point[1],c='red')57 new1_list.append(point)58 # get new centroids 59 dt_temp0=pd.DataFrame(new0_list,columns=['x','y'])60 p0=(np.average(dt_temp0['x']),np.average(dt_temp0['y']))61 dt_temp1=pd.DataFrame(new1_list,columns=['x','y'])62 p1=(np.average(dt_temp1['x']),np.average(dt_temp1['y']))63 plt.scatter(p0[0],p0[1],c='black',marker='x')64 plt.scatter(p1[0],p1[1],c='black',marker='x')65 plt.show()66 # update distance67 for i in range(M):68 point=(x_value[i],y_value[i])69 if distance(p0,point)<distance(p1,point): 70 plt.scatter(point[0],point[1],c='blue',marker='*')71 else:72 plt.scatter(point[0],point[1],c='red')73 plt.scatter(p0[0],p0[1],c='black',marker='x')74 plt.scatter(p1[0],p1[1],c='black',marker='x')75 plt.show()The result is as follows.