 C++程序性能分析工具gperftools
北京理工大学 | 李明健
在程序性能优化时,需要测试各函数的运算时间,Linux 下可采用 Google 开源的 gperftools 工具集,它包括内存分析和 cpu 时间分析,下面介绍时间分析工具 cpu-profiler。
首先注意这个版本直接下载完是不能编译新的求解器的,打开以后,安装
x# 拉取源代码git clone https://github.com/gperftools/gperftools.git# 安装依赖automake工具sudo apt-get install autoconf automake libtool# 进入源代码目录,编译./autogen.sh./configuremakesudo make install 随后会自动编译,库会写在 usr/local里面。
如果用 Cmake 编译,需要为该工具集写一个 FindPROFILER.cmake文件,然后将该文件放在 usr/shared/cmake-3.x/Modules 目录下,用于 find_package 查找,该文件内容如下:
xxxxxxxxxxif(LIBPROFILER_FOUND)    return()endif()# include (depcommon)# linux系统下调用pkg-config查找profilerif (NOT WIN32)    include(FindPkgConfig)    unset(_verexp)    if(LIBPROFILER_FIND_VERSION)        if(LIBPROFILER_FIND_VERSION_EXACT)                      set(_verexp "=${LIBPROFILER_FIND_VERSION}")        else()              set(_verexp ">=${LIBPROFILER_FIND_VERSION}")        endif()    endif()    pkg_check_modules (LIBPROFILER libprofiler${_verexp})endif()
if (NOT LIBPROFILER_FOUND)    # windows系统下通过查找头文件 gperftools/profiler.h和find_library 查找profiler来实现    # find the headfile of library    set (PROFILER_HEADS gperftools/profiler.h)    find_path (LIBPROFILER_INCLUDE_DIRS ${PROFILER_HEADS})
    set (PROFILER_NAMES ${PROFILER_NAMES} profiler)    find_library (LIBPROFILER_LIBRARY NAMES ${PROFILER_NAMES})
    # just find one of dependency, guess other one.    if (NOT LIBPROFILER_LIBRARY AND LIBPROFILER_INCLUDE_DIRS)        message ("We just find the headfile, try to guess the library location.")        set (LIBPROFILER_LIBRARY_DIRS "${LIBPROFILER_INCLUDE_DIRS}/../lib")        find_library (LIBPROFILER_LIBRARY NAMES ${PROFILER_NAMES} PATHS ${LIBPROFILER_LIBRARY_DIRS})    elseif (NOT LIBPROFILER_INCLUDE_DIRS AND LIBPROFILER_LIBRARY)        message ("We just find the lib file, try to guess the include location.")                get_filename_component(LIBPROFILER_LIBRARY_DIRS ${LIBPROFILER_LIBRARY} DIRECTORY)        find_path (LIBPROFILER_INCLUDE_DIRS ${PROFILER_HEADS} "${LIBPROFILER_LIBRARY_DIRS}../included")    endif()
    # find the library.    if (LIBPROFILER_INCLUDE_DIRS AND LIBPROFILER_LIBRARY)        if (NOT LIBPROFILER_LIBRARY_DIRS)                                    get_filename_component(LIBPROFILER_LIBRARY_DIRS ${LIBPROFILER_LIBRARY} DIRECTORY)        endif ()        list(APPEND profiler pthread)    endif()else ()        list(GET MGNCS_LIBRARIES 0 _name)    find_library (LIBPROFILER_LIBRARY NAMES ${LIBPROFILER_LIBRARIES} PATHS ${LIBPROFILER_LIBRARY_DIRS})endif()# handle the QUIETLY and REQUIRED arguments and set LIBPROFILER_FOUND to TRUE if# all listed variables are TRUEinclude(FindPackageHandleStandardArgs)FIND_PACKAGE_HANDLE_STANDARD_ARGS(LIBPROFILER DEFAULT_MSG    LIBPROFILER_LIBRARIES LIBPROFILER_INCLUDE_DIRS)
if(LIBPROFILER_FOUND)    set(_static_libname libtcmalloc_and_profiler.a)    find_library (LIBPROFILER_STATIC_LIBRARY NAMES ${_static_libname} PATHS ${LIBPROFILER_LIBRARY_DIRS})    if(NOT LIBPROFILER_FIND_QUIETLY)        message(STATUS "  -I: ${LIBPROFILER_INCLUDE_DIRS}")        message(STATUS "  -L: ${LIBPROFILER_LIBRARY_DIRS}")        message(STATUS "  -l: ${LIBPROFILER_LIBRARIES}")    endif()    find_library (LIBPROFILER_LIBRARY NAMES ${LIBPROFILER_LIBRARIES} PATHS ${LIBPROFILER_LIBRARY_DIRS})
    # create imported target    if (NOT TARGET gperftools::profiler)        add_library(gperftools::profiler INTERFACE IMPORTED)        if(LIBPROFILER_STATIC_LINK)            # for linking static profiler,must use libtcmalloc_and_profiler.a,see also README gperftools            set(_link_libs ${LIBPROFILER_STATIC_LDFLAGS})            if(NOT LIBPROFILER_STATIC_LIBRARY)                message(FATAL_ERROR "NOT FOUND static library for profiler:${_static_libname} ")            endif()      # 替换 profiler 为 :libtcmalloc_and_profiler.a            string(REPLACE profiler :${_static_libname} _link_libs "${_link_libs}")        else()            set(_link_libs ${LIBPROFILER_LDFLAGS})        endif()        set_target_properties(gperftools::profiler PROPERTIES            INTERFACE_COMPILE_OPTIONS "${LIBPROFILER_CFLAGS_OTHER}"            INTERFACE_INCLUDE_DIRECTORIES "${LIBPROFILER_INCLUDE_DIRS}"            INTERFACE_LINK_LIBRARIES   "${_link_libs}"            )        if(NOT LIBPROFILER_FIND_QUIETLY)            message(STATUS "IMPORTED TARGET: gperftools::profiler,link libraies ${_link_libs}")        endif()    endif ()    endif(LIBPROFILER_FOUND)
下面只需要在Cmake里面加上
xxxxxxxxxxfind_package(PROFILER)target_link_libraries(${project_name} xx ${LIBPROFILER_LIBRARY})即可将库链接到可执行上。
在C++程序中,加入以下代码:
xxxxxxxxxxProfilerStart("test.prof");ProfilerStop();程序运行结束后,会生成 .prof 文件用于性能分析,有文字、图片等形式,如果需要图片显示,则要依赖 dot 包如下:
x
sudo apt-get install graphviz运行完程序以后查看:
x
# 查看文字pprof exe test.prof --text > 1.log# 浏览器查看 svgpprof exe test.prof --web显示结果如下:
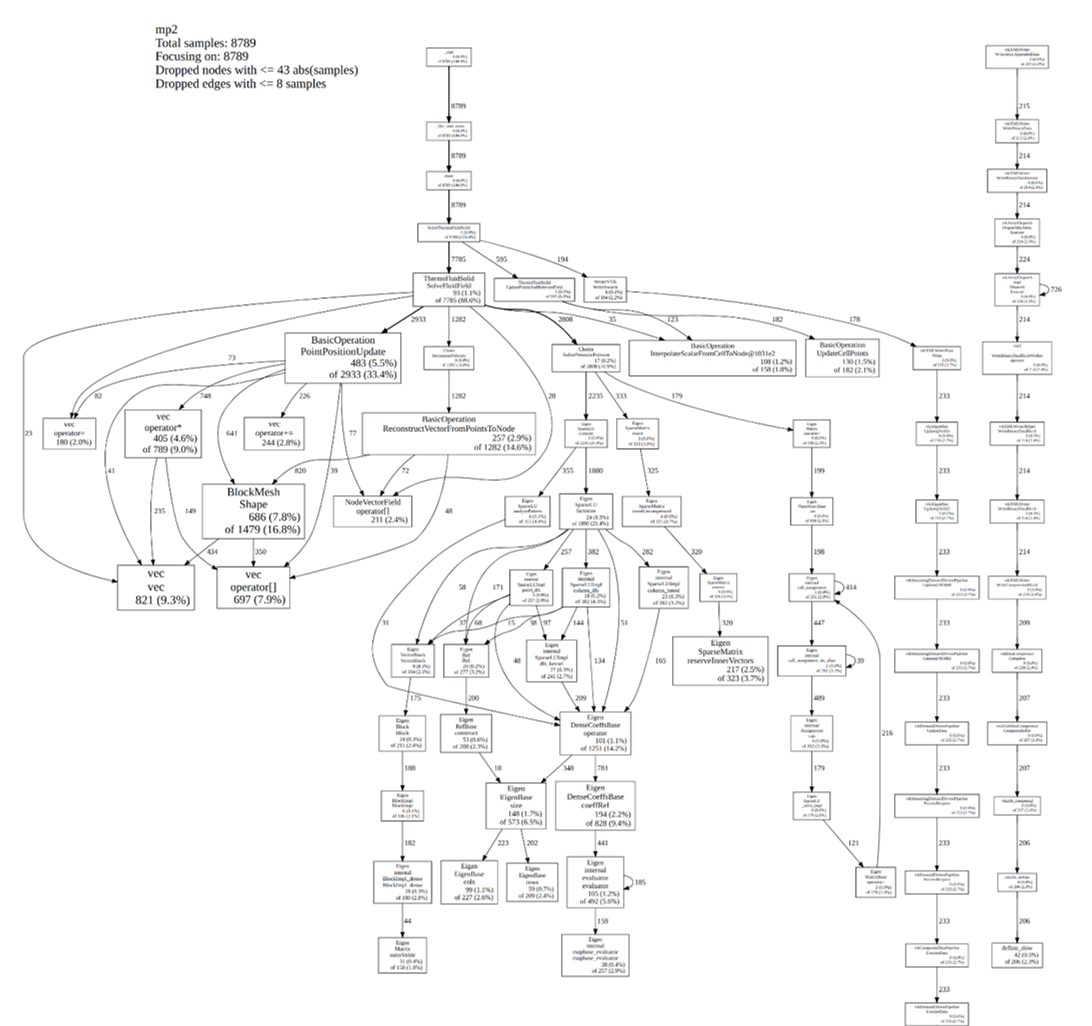
每10ms一个样本,能够看出各函数用时及其占比。